The impact of climatic influence on dengue infectious disease in Karachi, Pakistan
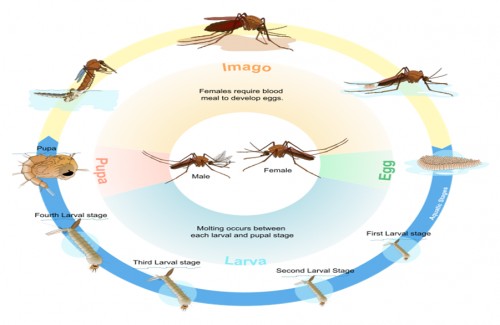 Fig. 1:
 The dengue Aedes-Aegypti Mosquito cycles
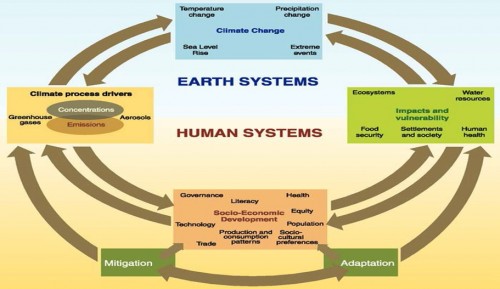 Fig. 2:
 The flow chart representing anthropogenic drivers, impacts of and responses to climate change, and their connection human health system
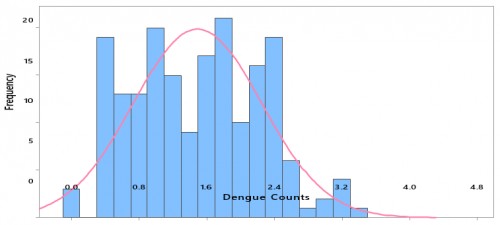 Fig. 3:
 Histogram Dengue Fever counts for positive skewed to the Right Tail
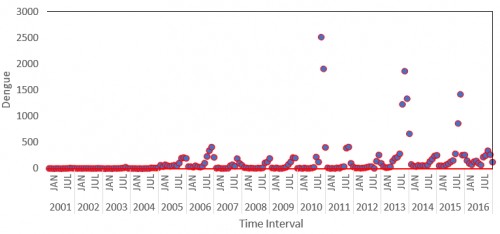 Fig. 4:
 The time series monthly plot for dengue count for the duration of 2001 to 2016
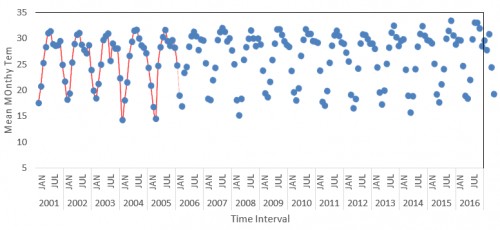 Fig. 5:
 Time series plot for mean monthly temperture for the period of 2001 to 2016.
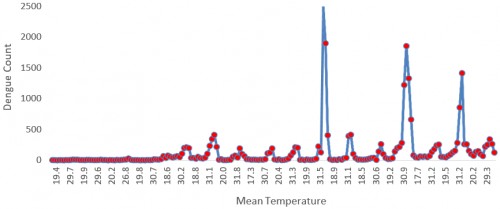 Fig. 6:
 The time series plot for mean monthly temperature verse monthly dengue count (2001 to2016)
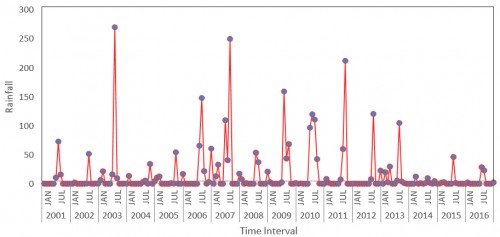 Fig. 7:
 Time series plot for monthly rainfall from 2001 to 2016.
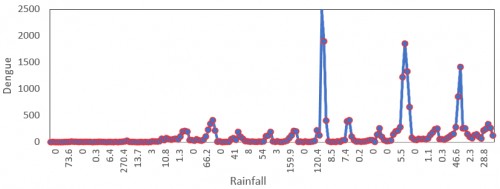 Fig. 8:
 The time series plot for mean monthly temperature verse monthly dengue count (2001 to2016).
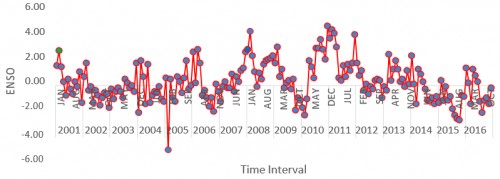 Fig. 9:
 The time series plot for monthly ENSO3.4 index from 2001 to 2016.
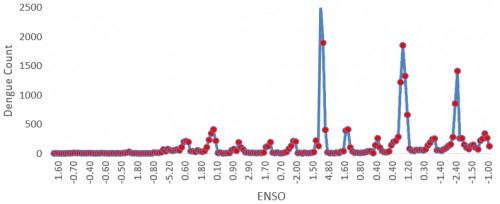 Fig. 10:
 The time series plot for monthly ENSO 3.4 Index verse Dengue count from 2001 to 2016.
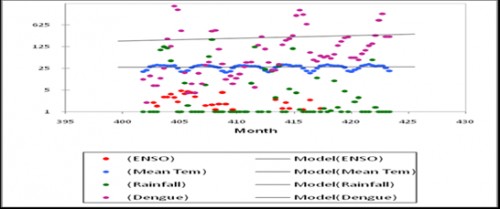 Fig. 11:
 Trend analysis for monthly ENSO3.4 index, Temperature, Rainfall with Dengue counts.


