Synthesis, molecular docking and insecticidal activity evaluation of chromones of date palm pits extract against Culex pipiens (Diptera: Culicidae)
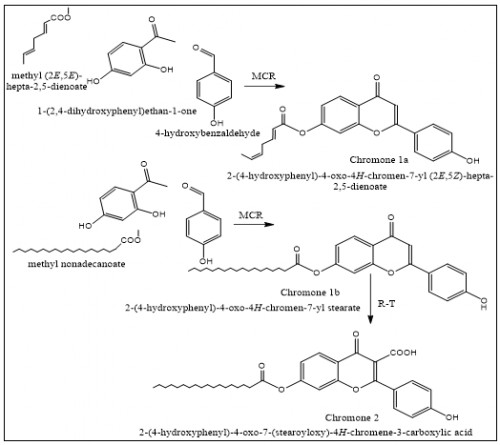 Fig. 1:
 Outline the synthetic route of the chromone 1 and 2
 Fig. 2:
 Outline the chemical flavonoid structures; chromone1 and chromone 2 isolated from date pits methanolic extract 70%.
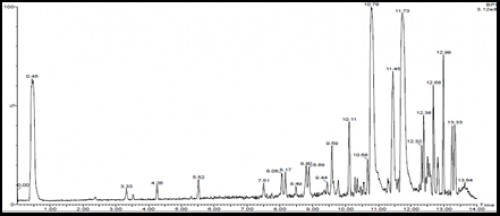 Fig. 3:
 Outline HPLC and time retention of high % yield of chromone derivatives 1 and 2 as represented by LJ 10.78 and LJ 11.73 respectively.
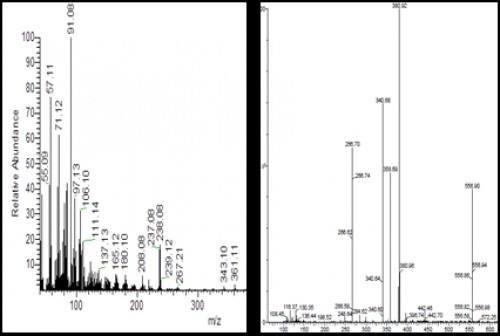 Fig. 4:
 Outline mass spectra of the chromone 1 (left) and chromone 2 (right)
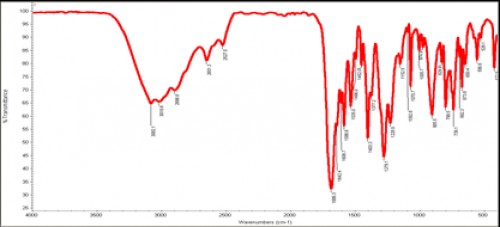 Fig. 5:
 Outline IR spectrum of isolated chromone 1.
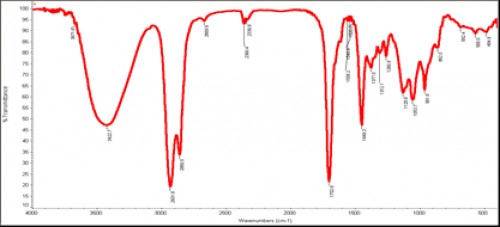 Fig. 6:
 Outline IR spectrum of isolated chromone 2
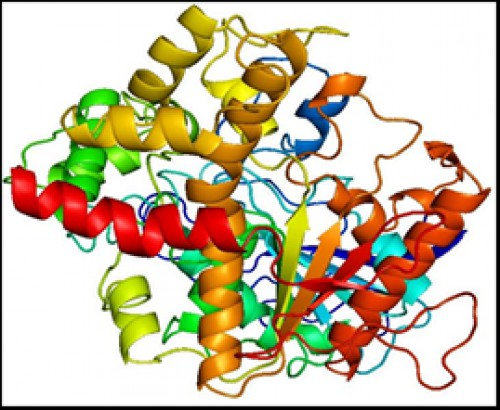 Fig. 7:
 Three dimensional (3D) model of AChE, containing 24 α-helices and 16 β-strands.
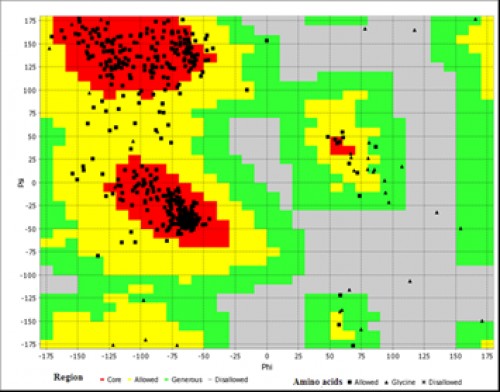 Fig. 8:
 Ramachandran plot analysis of AChE. The red area represents the most favourable region of amino acid residues; the yellow region is additionally allowed and the generously allowed residues are in the green region
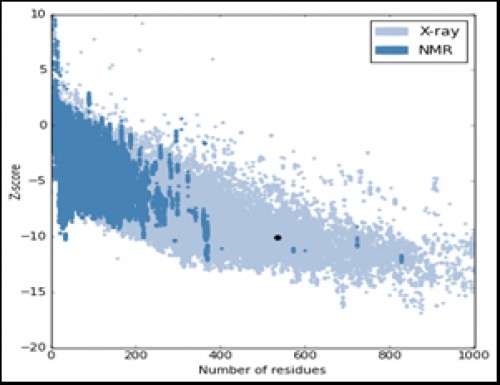 Fig. 9:
 The local model quality of the AChE.
The enzyme Z-score (-10.12) falls in the range of the Z-score for PDB enzymes whose structures are determined by NMR (dark blue region) and X-ray crystallography (light blue region), which indicates a good quality model.
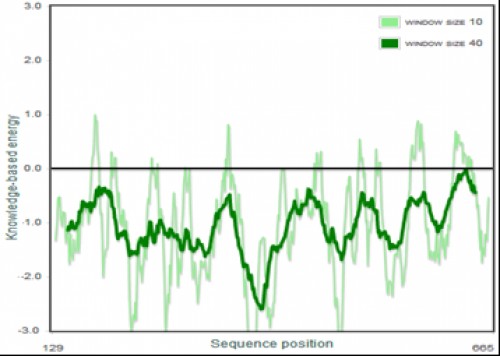 Fig. 10:
 The Pro SA of the 3D model of AChE enzyme. The energy of maximum amino acid residues is within the negative region, indicating a good quality model
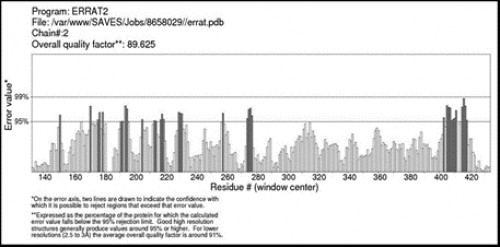 Fig. 11:
 ERRAT plot of AChE enzyme showing 89.625% overall quality factor.
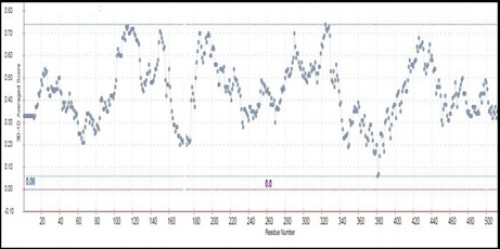 Fig. 12:
 The Verify_3D value of AChE
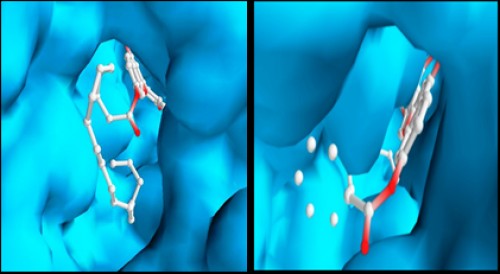 Fig. 13:
 Schematic representation of the best docked poses of chromone derivatives (1 and 2) with AChE.
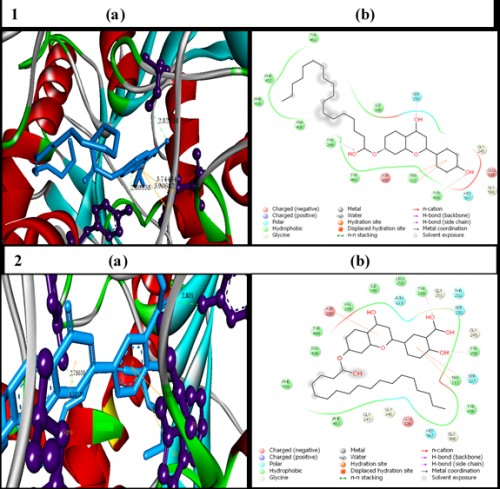 Fig. 14: In silico
 molecular docking of the chromone derivatives 1 & 2 with the target enzyme3 Dimensional representation of the AChE-ligand complex. The binding residues are shown in violet ball and stick and the hydrogen bonds are represented by green dotted lines. The ligand molecules are shown in cyan stick model.2 Dimensional representation, the amino acids are shown in 3 letter code, and H-bonds in pink dotted lines, Pi-Pi and Pi-sigma interactions are shown in orange line.


