Vol. 5, Issue 1, Part A (2018)
DNA barcoding as a complementary approach for species identification from dengue endemic regions of North East India
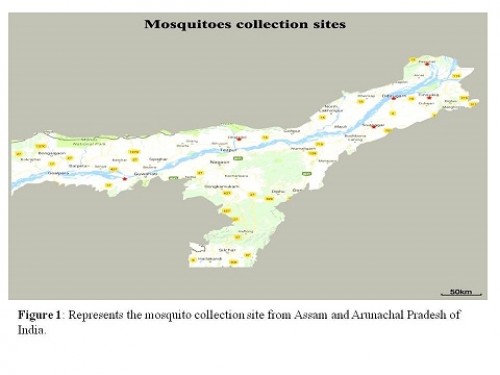
Fig. 1: Represents the mosquito collection site from Assam and Arunachal Pradesh of India.
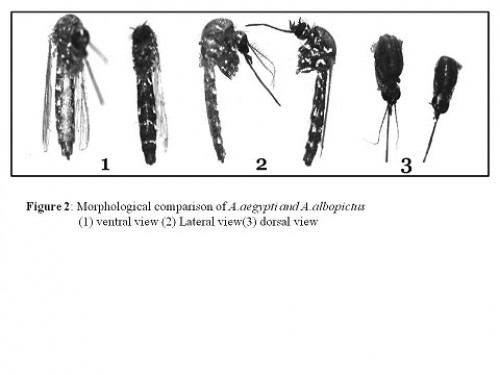
Fig. 2: Represents the morphological comparison of A. aegypti and A. albopictus (1) ventral view (2) Lateral view (3) dorsal view
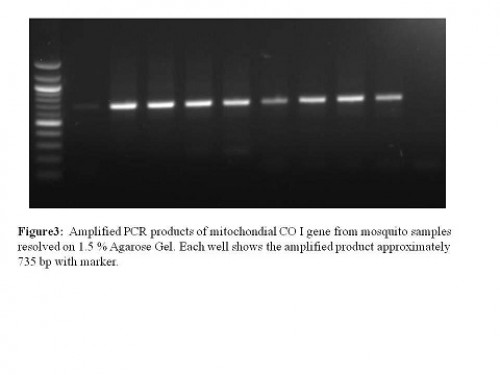
Fig. 3: Represents the amplification of mitochondrial CO1 gene using the specific primers, each lane shows the amplified product approximately 735 base pair with marker.
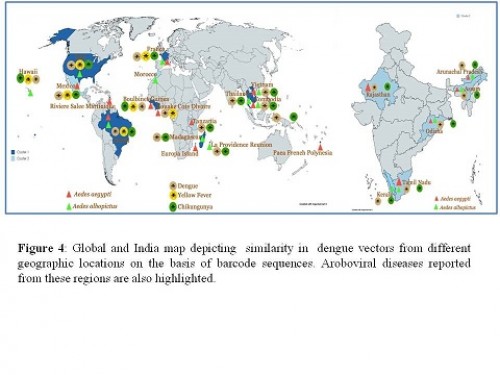
Fig. 4: Represents Global and India map depicting similarity in dengue vectors from different geographic locations on the basis of barcode sequences. Aroboviral diseases reported from these regions are also highlighted.
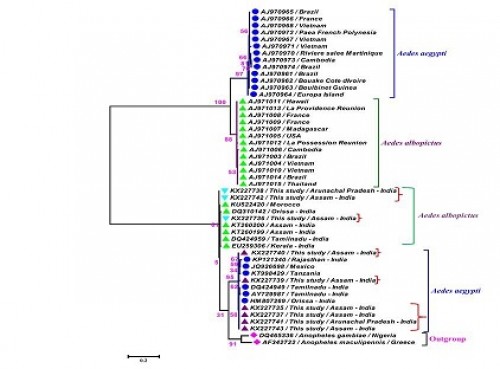
Fig. 5: Explains about the phylogenetic tree of sequences from mosquito species from Assam and Arunachal Pradesh (highlighted by red curly bracket) in this study and sequences downloaded from databases using MEGA6 and K2P model.


