Malaria trend and effect of rainfall and temperature within Regions 7 and 8, Guyana
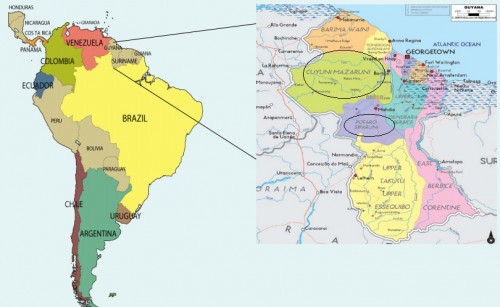 Fig. 1:
 Map of Guyana highlighting the study regions
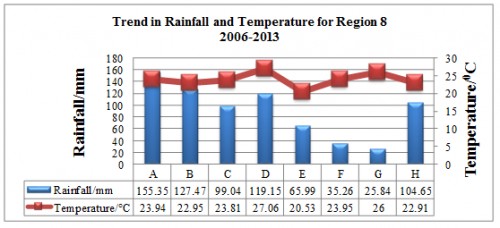 Fig. 2:
 Trend in Rainfall and Temperature in Region 8 (A-H indicates for 2006-2013)
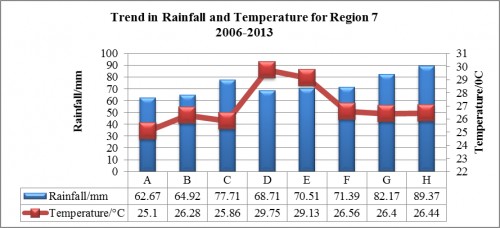 Fig. 3:
 showing Trend in Rainfall and Temperature in Region 7 (A-H indicates for 2006-2013)
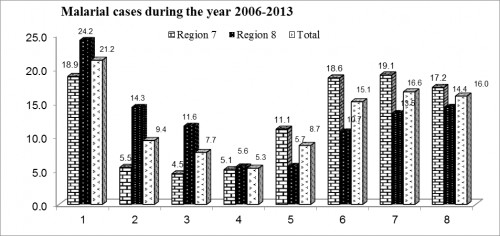 Fig. 4:
 Comparison of total malarial cases in region 7 and region 8.
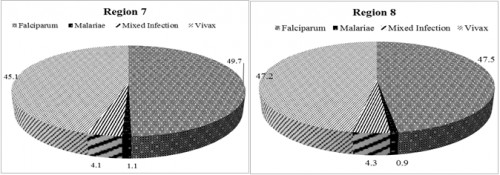 Fig. 5:
 Percentage of individual parasite species in region 7 and region 8.
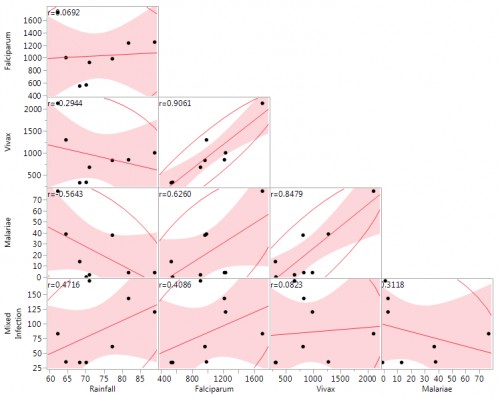 Fig. 6:
 Graph showing correlation between rainfall and plasmodium species in region 7
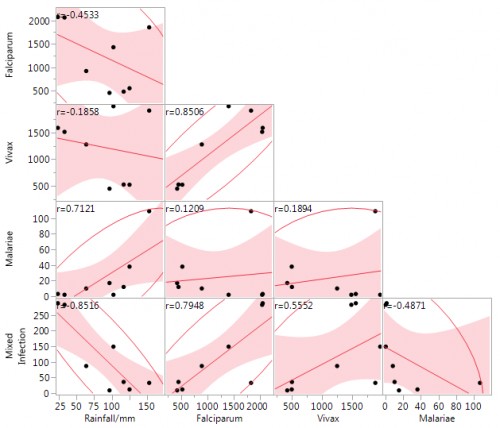 Fig. 7:
 Graph showing correlation between rainfall and plasmodium species in region 8
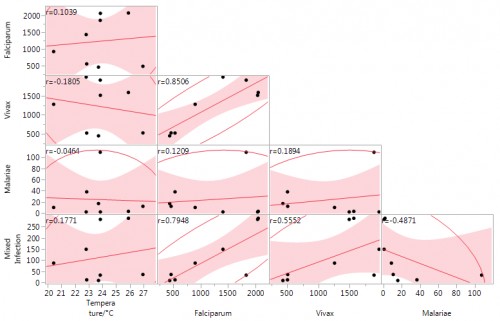 Fig. 8:
 Graph showing correlation between rainfall and plasmodium species in region 8
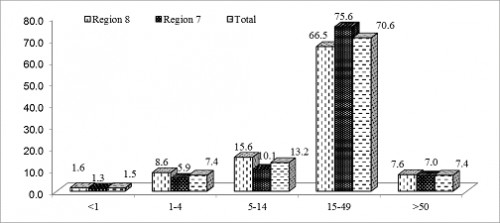 Fig. 9:
 Percentage of malarial cases among different age groups
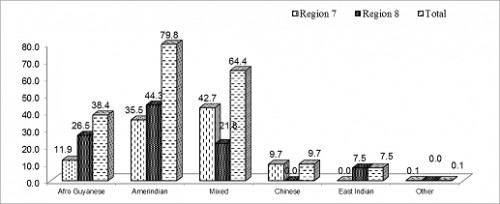 Fig. 10:
 Prevalence of malarial parasite among different ethnic groups
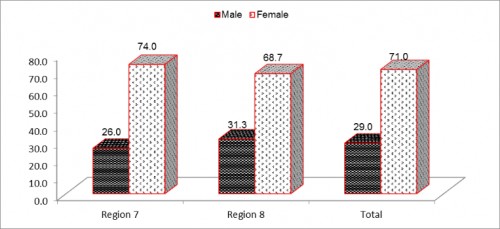 Fig. 11:
 Prevalence of malarial cases distributed among male and female populations


