Impact of sublethal conventional and biorational larvicidal stress on fitness status in nutritionally challenged Aedes aegypti larvae
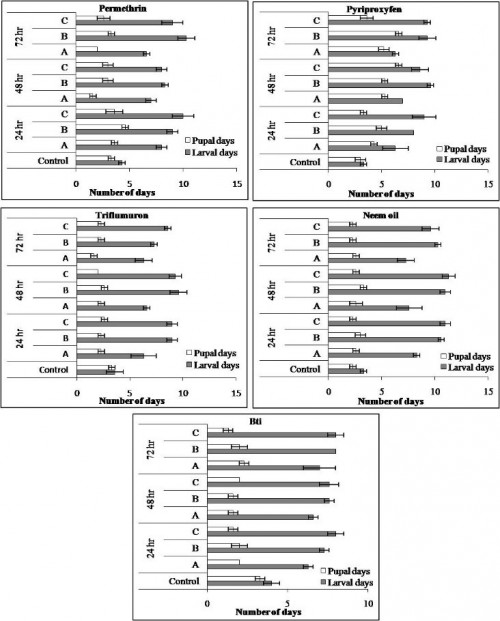 Fig. 1:
 Mean larval and pupal developmental period of
Ae. aegypti following treatment with various larvicides. Alphabets indicate: A - LC
10; B - LC
25; C - LC
50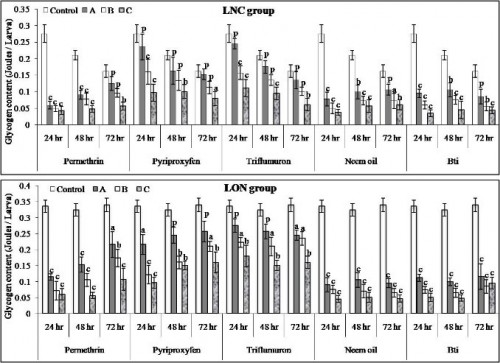 Fig. 2:
 Effects of larvicidal treatment following with or without food on glycogen content of
Ae. aegypti larvae. Data represented as mean ± S.E.M (n=3). Alphabets indicate significant differences per larva between control and treatments (
aP< 0.05,
bP< 0.01, cP < 0.001 and p - non significant).
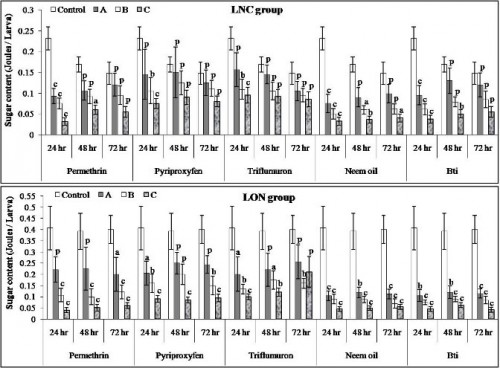 Fig. 3:
 Effects of larvicidal treatment following with or without food on sugar content of
Ae. aegypti larvae. Data represented as mean ± S.E.M (n=3). Alphabets indicate significant differences per larva between control and treatments (
aP< 0.05,
bP< 0.01, cP < 0.001 and p - non significant).
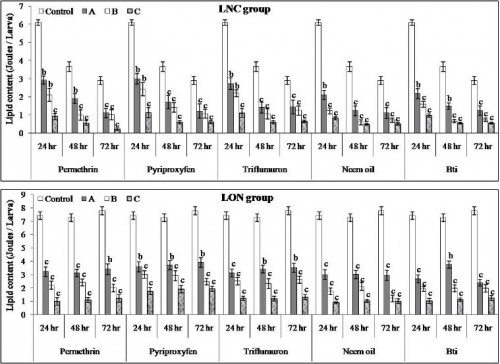 Fig. 4:
 Effects of larvicidal treatment following with or without food on lipid content of
Ae. aegypti larvae. Data represented as mean ± S.E.M (n=3). Alphabets indicate significant differences per larva between control and treatments (
aP<0.05,
bP<0.01,
cP<0.001 and p - non significant).