- Printed Journal
- Indexed Journal
- Refereed Journal
- Peer Reviewed Journal

Subscribe Print Journal

Zoological Record Indexing

Important Information
- Helpline for Authors
- India: +91-9711224068
- Toll Free: 1800-1234070
- Working hours 10:00 AM-06:00 PM
Issue Bar
Open Access
Side Bar
Identifier

Vol. 3, Issue 1, Part A (2016)
Immune stimulation of Anopheles gambiae 4a3B cells induces chromatin reorganization at the Defensin 1 gene
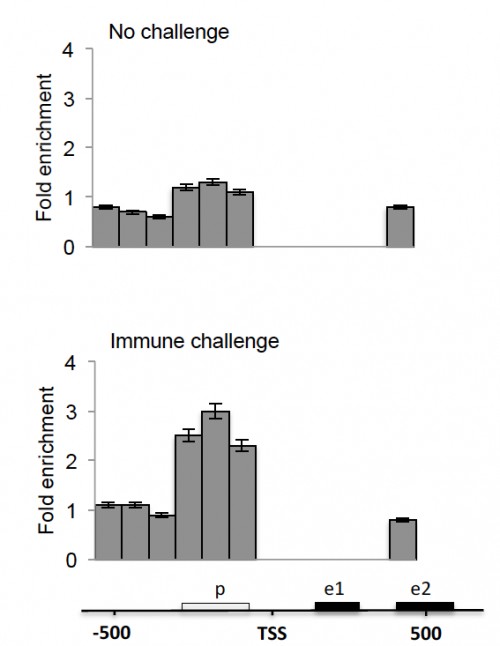
Fig. 1: The Def1 promoter lies within an open chromatin site in immune stimulated 4a3B cells. Open chromatin profiling for the proximal Def1 locus. Grey bars indicate enrichment for each amplicon(1 to 6 and e2, see Table 1) in the open chromatin sample relative to a control sample. Bottom: diagram of the Def1 locus, coordinates are in base pairs relative to the transcription start site (TSS). The open box indicates the position of the promoter and black boxes indicate exons
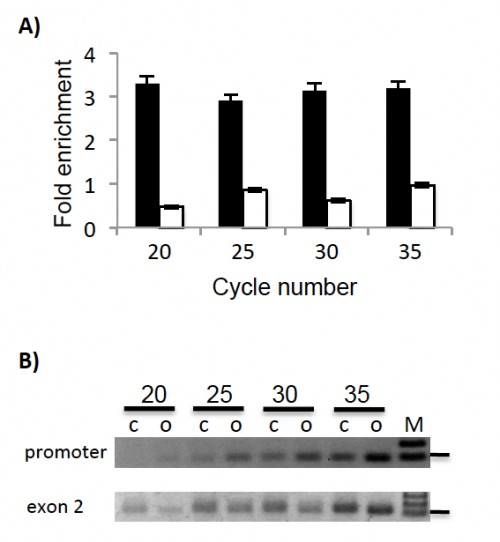
Fig. 2: Open chromatin is detected by a fast prep protocol at the Def1 promoter by semiquantitative PCR. Fast prep open chromatin sample and control aliquots were used as templates for semi quantitative PCR detection. Aliquots from the PCR reaction were taken at cycles 20, 25, 30 and 35 for each amplicon. Fluorescence intensities of PCR products were measured on Ethidium Bromide stained gels with the ImageJ software. A) The fold increase or decrease was determined by the ratio of fast prep open chromatin sample relative to control sample. Black bars correspond to an amplicon located at the promoter region and white bars correspond to an amplicon located at the Def1 second exon. B) PCR product fragments were migrated in agarose gels and stained with ethidium bromide. Numbers indicate cycle number; c, control sample; o, open chromatin sample; M, molecular weight marker; horizontal line beside gel images indicate the 100 bp marker. Top: promoter amplicon. Bottom: exon 2 amplicon
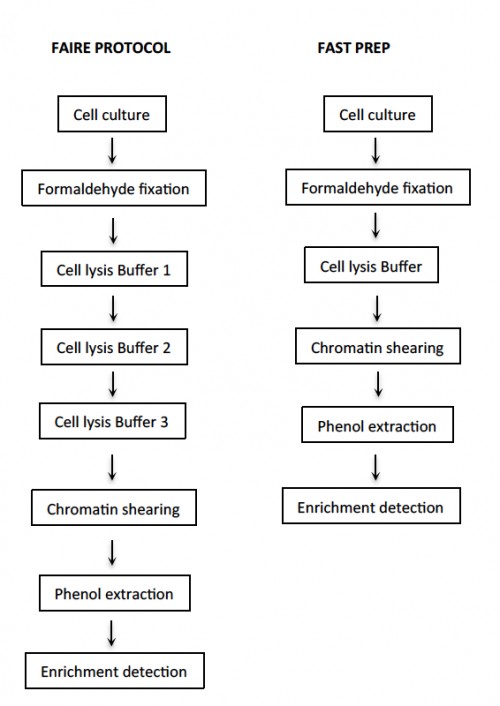
Fig. 3: Open chromatin profiling protocol comparison. Diagram shows key steps in preparation of open chromatin samples. The main difference between protocols is the use of a single step for cell lysis in the fast prep protocol; detection can be done by qPCR or semi quantitative PCR. Other steps are carried out in the same way in both protocols.
Zoological Record Indexing
Important Information
- Helpline for Authors
- India: +91-9711224068
- Toll Free: 1800-1234070
- Working hours 10:00 AM-06:00 PM
Issue Bar
Open Access
Side Bar
Identifier
Related Links

International Journal of Mosquito Research