Vol. 2, Issue 2, Part A (2015)
Describing variations in wing shapes of Anopheles flavirostris detected positive and negative of filaria using relative warp and Euclidean distance matrix analysis
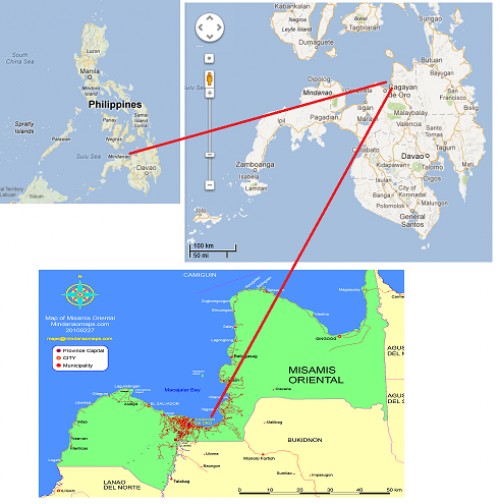
Fig. 1: Map showing study area
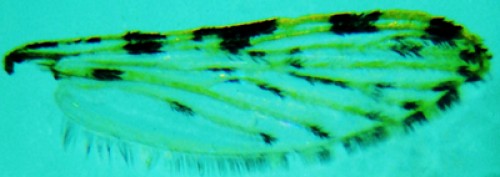
Fig. 2: An. flavirostris wing samples collected from Misamis Oriental
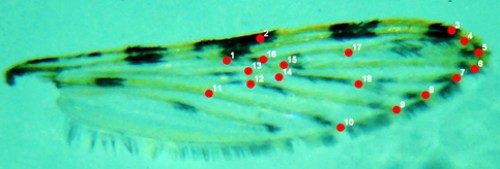
Fig. 3: An. flavirostris wing with typical wing spots

Fig. 4: Matrix of distances between landmarks.
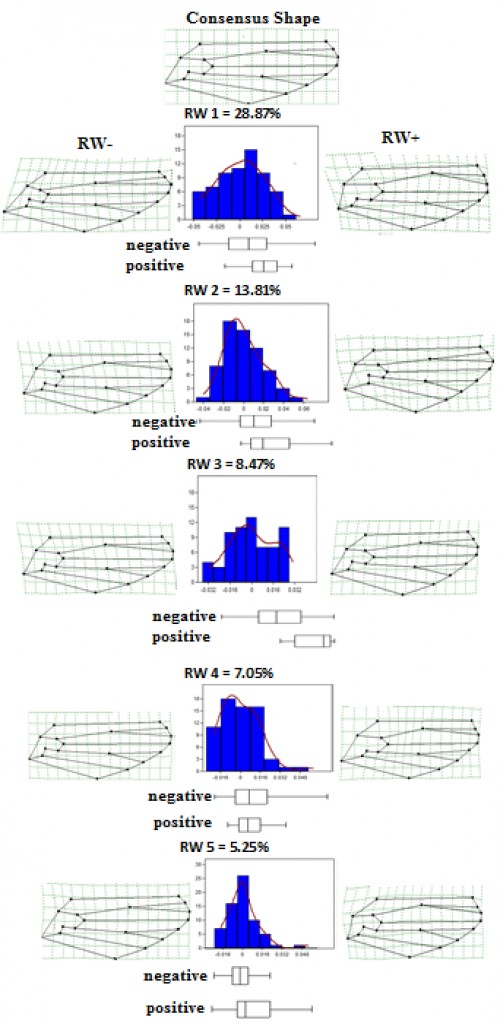
Fig. 5: Significant relative warps showing the variation in shapes of the wing of An. flavirostris
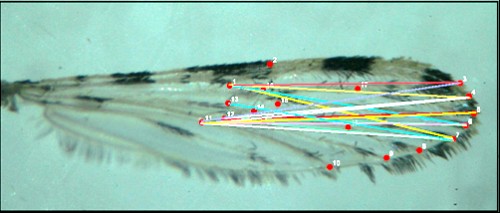
Fig. 6: EDMA interlandmark distances of wing shape pattern of An. flavirostris.


