- Printed Journal
- Indexed Journal
- Refereed Journal
- Peer Reviewed Journal

Subscribe Print Journal

Zoological Record Indexing

Important Information
- Helpline for Authors
- India: +91-9711224068
- Toll Free: 1800-1234070
- Working hours 10:00 AM-06:00 PM
Issue Bar
Open Access
Side Bar
Identifier

Vol. 1, Issue 3, Part A (2014)
Spatial cognition: a geospatial analysis of vector borne disease transmission and the environment, using remote sensing and GIS
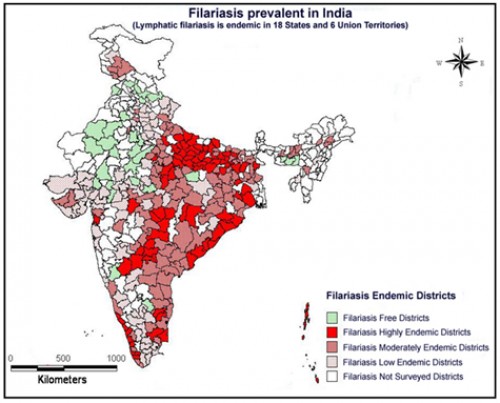
Fig. 1: Filariasis Endemics in India as on 2012, source: M.Palaniyandi, 2014
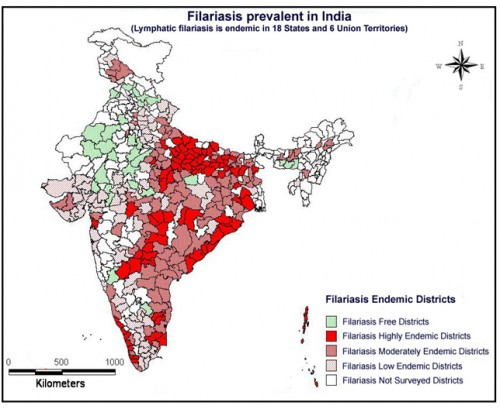
Fig. 2: The first report of JE epidemics across the country and the spatial diffusion of JE epidemics in the newer areas, where the intensive wet cultivation is being practiced.(1956-2012), source: M.Palaniyandi, 2013
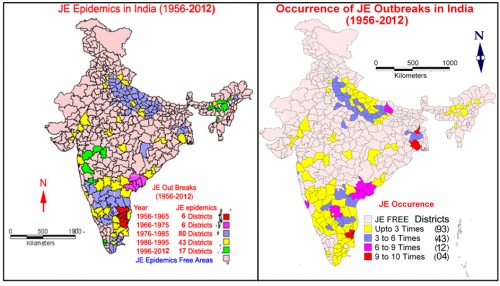
Fig. 3: The repeated occurrence of JE epidemics in the country and the spatial diffusion of JE epidemics in the newer areas where the intensive wet cultivation was practiced (1956-2012)., source: M.Palaniyandi, 2013
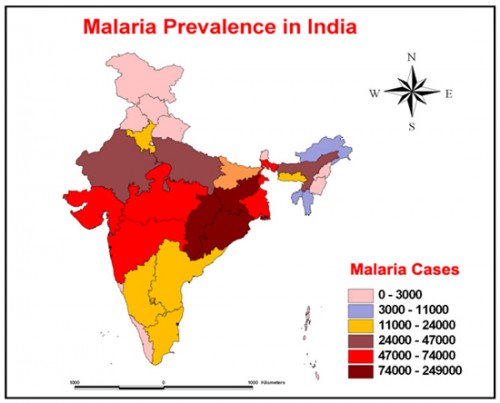
Fig. 4: The malaria prevalence of States and the Union Territories in India, as on 2012, Source: M.Palaniyandi, 2013
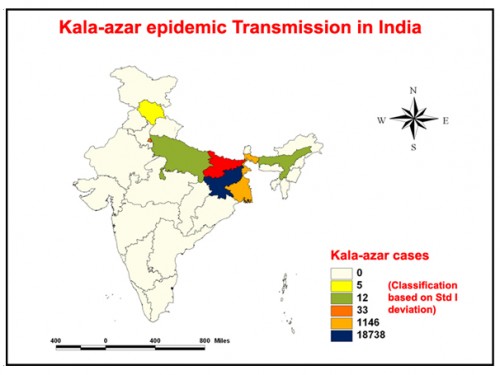
Fig. 5: Visceral Leishmaniasis distribution in the selected states of India (2012), source: M.Palaniyandi, et al., 2014 (in press)
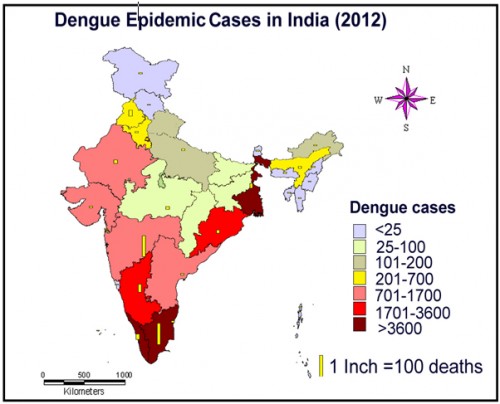
Fig. 6: The dengue epidemics in India (2012), source: M.Palaniyandi, 2013
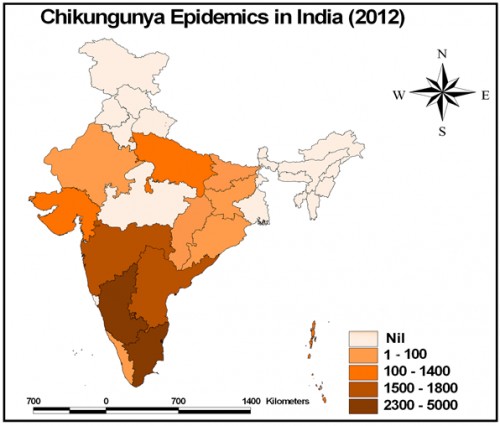
Fig. 7: The Chikungunya epidemics in India (2012), source: M.Palaniyandi, 2013
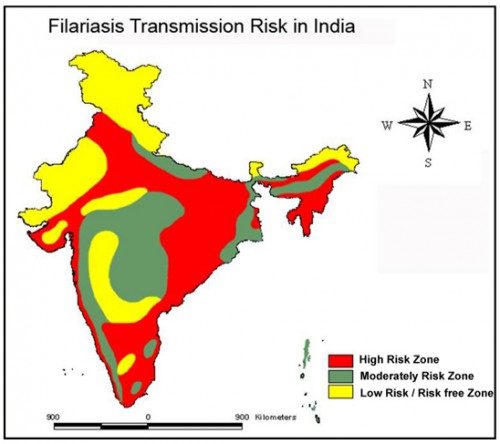
Fig. 8: Filariasis Transmission Risk Map of India. Source: M.Palaniyandi, 2014
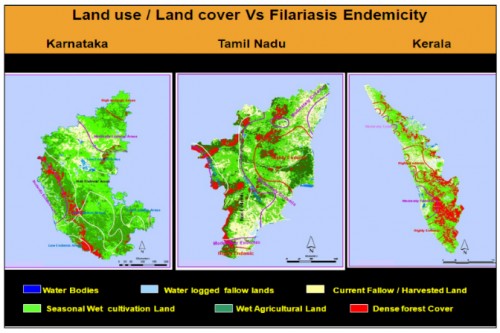
Fig. 9: The spatial relationship between the IRS WiFS data and the Filariasis Endemicity in Karnataka, Tamil Nadu and Kerala states of South India, The Filariasis Endemicity level contour map is overlaid on land use / land cover map derived from satellite data. Source: M.Palaniyandi, 2014
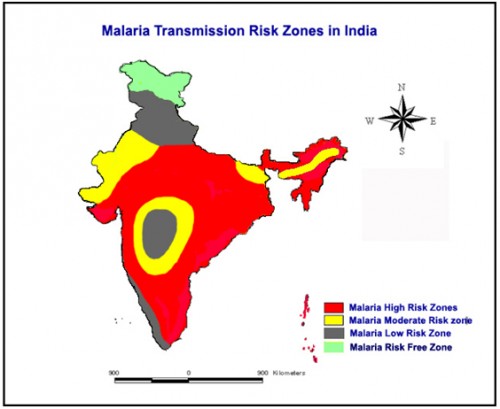
Fig. 10: Malaria transmission risk in India, Map Source; M.Palaniyandi 2013
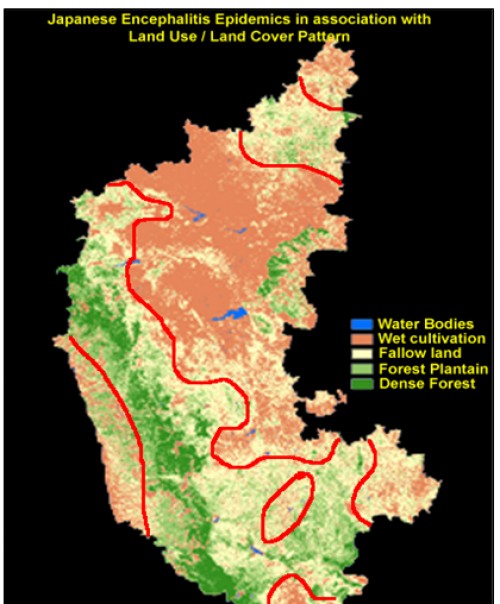
Fig. 11: The spatial association between the land use categories of satellite remote sensing IRS WiFS data of Karnataka State in India, Source: M.Palaniyandi, 2013
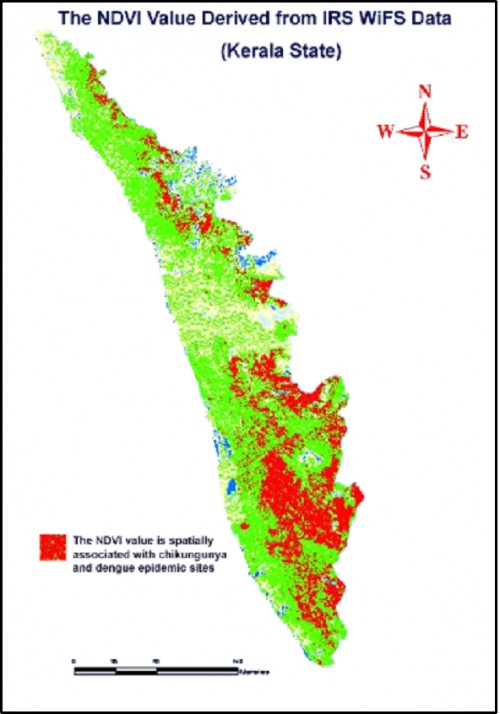
Fig. 12: The spatial association between the NDVI value of IRS WiFS data and dengue and chikungunya epidemics transmission areas in Kerala state. Source: M.Palaniyandi, 2014.
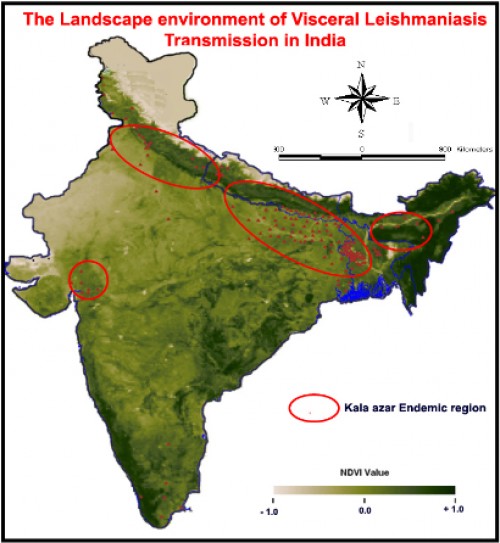
Fig. 13: The Visceral Leishmaniasis / Kala-azar endemic data is overlaid on the mean NDVI; value; map of IRS WiFS data of India, the geographical distribution of Visceral Leishmaniasis is spatially associated with mean composite NDVI value range between; 0.08 - 0.53, (95% significance and; 5%; error precision with confidence interval, CI- 0.413 -0.544), p value <0.001. Source: M.Palaniyandi, et al., 2014
Zoological Record Indexing
Important Information
- Helpline for Authors
- India: +91-9711224068
- Toll Free: 1800-1234070
- Working hours 10:00 AM-06:00 PM
Issue Bar
Open Access
Side Bar
Identifier
Related Links

International Journal of Mosquito Research