- Printed Journal
- Indexed Journal
- Refereed Journal
- Peer Reviewed Journal
Subscribe Print Journal

Zoological Record Indexing

Important Information
- Helpline for Authors
- India: +91-9711224068
- Toll Free: 1800-1234070
- Working hours 10:00 AM-06:00 PM
Issue Bar
Open Access
Side Bar
Identifier

Vol. 2, Issue 3, Part C (2015)
Characterization of mosquito breeding sites in the Cape Verde islands with emphasis on major vectors
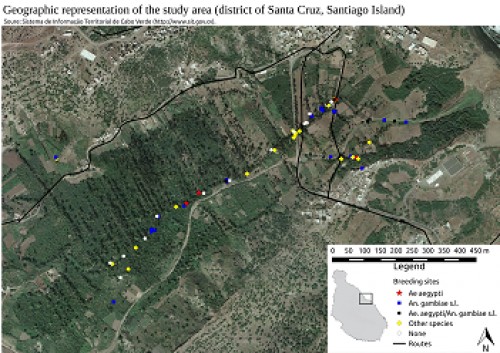
Fig. 1: Geographic localization of the study area. Santa Cruz is a district located in the eastern coast of Santiago Island. The coordinates of each breeding sites were taken by using a GPS at the moment of sampling (see Methods). Ae. aegypti breeding sites are represented by a red star. A blue squared represent An. gambiae s.l. breeding sites while those where both species occurred are represented by a black circle. Breeding sites where these two species did not occurred are represented by yellow diamond while non-productive water collections at the moment of sampling are represented by white circle
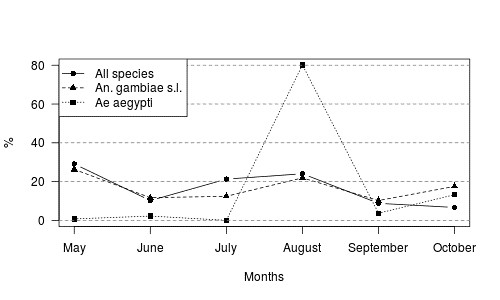
Fig. 2: Number of mosquitoes collected over the period of the study. The number of mosquito collected per month was divided by the total collected over the period of this study. The collection rate of An. gambiae s.l. follow the collection rate of all mosquito collected during this study. However the collection rate of Ae. aegypti showed a different pattern. More than 80% of this specie was collected only in August
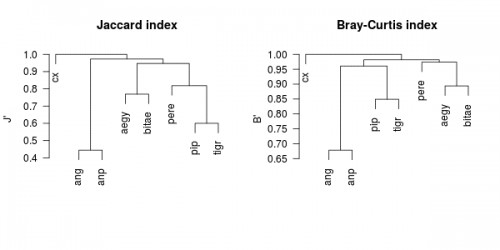
Fig. 3: Jaccard and Bray-Curtis index as computed using the same data set. Dissimilarity was calculated by using 1-X where X is whether Jaccard index or Bray-Curtis index. Dissimilarity coefficient was used to compute hierarchical cluster analysis. Legend: anp - An. pretoriensis, ang - An. gambiae s.l., aegy - Ae. aegypti, bitae - Cx. bitaeniorynchus,pip-Cx.pipienss.l.,tigr-Cx.tigripes,cx-Culexsp
![The variation of temperature (top), pH (center) and sodium chloride content (bottom) among mosquito breeding habitat sampled in the course of this study. The mean values between groups were compared using pairwise Wilcoxon rank sum test <sup>[26]</sup>. Significant differences are represented as letters on top](https://www.dipterajournal.com/up/graphics/90/191210062057903.png)
Fig. 4: The variation of temperature (top), pH (center) and sodium chloride content (bottom) among mosquito breeding habitat sampled in the course of this study. The mean values between groups were compared using pairwise Wilcoxon rank sum test [26]. Significant differences are represented as letters on top
Zoological Record Indexing
Important Information
- Helpline for Authors
- India: +91-9711224068
- Toll Free: 1800-1234070
- Working hours 10:00 AM-06:00 PM
Issue Bar
Open Access
Side Bar
Identifier
Related Links

International Journal of Mosquito Research